Data Analyst Career Accelerator Program – Ruby Cohort
Unlock Your Potential: Become a Highly Sought-After Data Analyst
- 12 Weeks, Instructor-led online classes (4 hours per week)
- Classes start: 12th July, 2025
Accelerate your path to a successful career in data analytics with our 12-week instructor-led program. This structured training provides a comprehensive approach to mastering essential tools and techniques, fast-tracking your journey to a high-growth career in data analytics.
Why Choose Our Training Program?
- Internship Opportunity: Top participants get an exclusive internship for hands-on experience, mentorship, and real-world projects to boost their portfolio.
- Expert Instructors: Learn from industry experts with years of experience in data and analytics.
- Comprehensive Curriculum: Our program covers everything you need to succeed, from basics to advanced techniques.
- Capstone Project: Showcase your new skills by completing real-world data analysis projects and receive personalized feedback from industry partners.
- Convenient Timing: Training hours will not interfere with your work schedule.
- After Training Support: Get support from industry experts and career coaches.
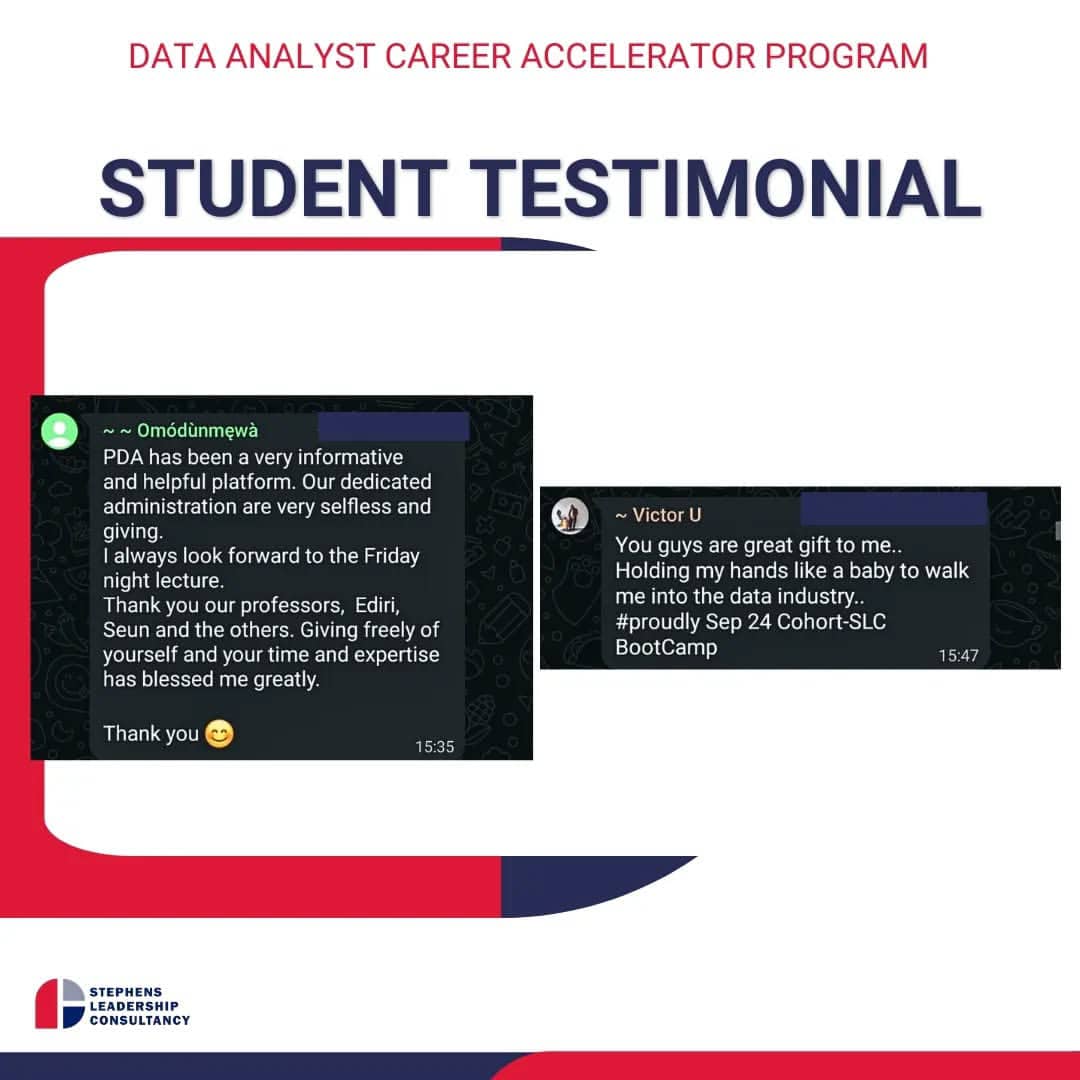
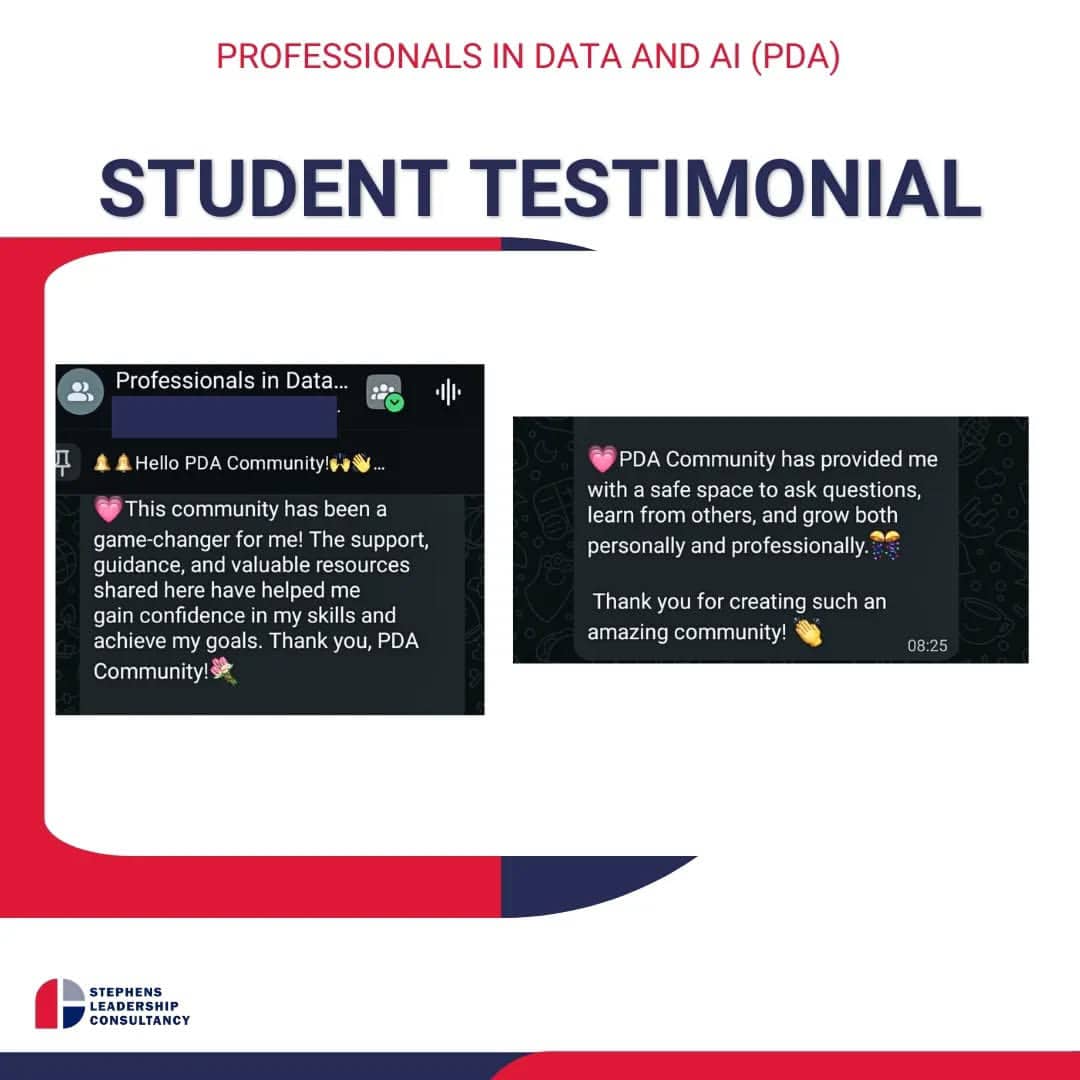
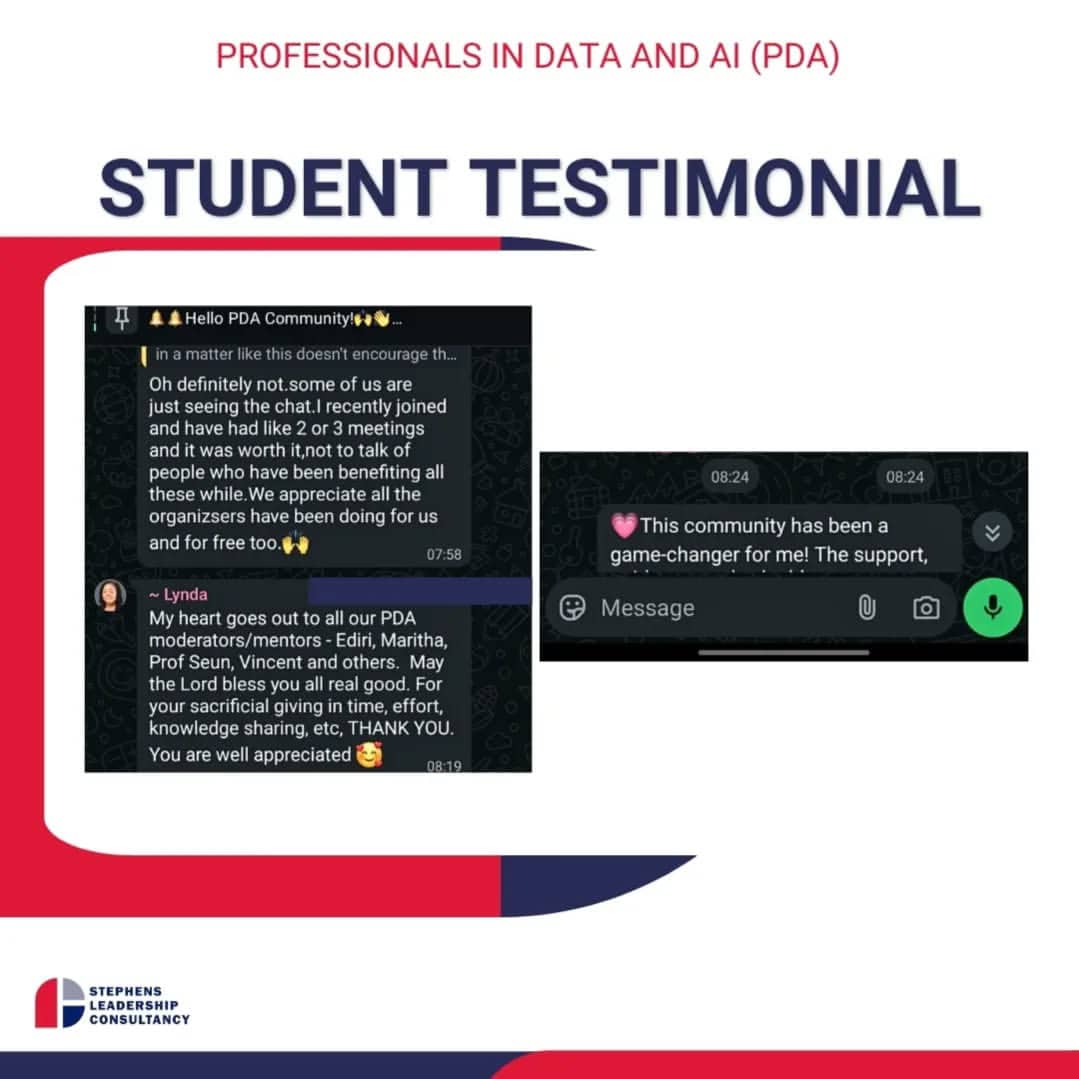
Testimonies
Bonus Benefits
- Become a highly skilled Data Analyst in MS Excel, SQL, Python, Power BI, Data Storytelling
- Microsoft Power BI Certification Prep
- Resources for Continuous Learning
- Career Support – Post Training Support and Hand-holding (3 months)
- Free Membership to Join a Vibrant Data Community
- Internship Opportunity
- Create an Impressive and Eye-Catching Portfolio on GitHub
- ATS-Optimized Resume
- Free Interview Prep
Who Should Attend?
This program is for anyone who wants to:
- Accelerate their career as a data analyst.
- Professionals seeking to advance their careers.
- Switch to a data analyst role, from a related or unrelated field.
- Business Leaders aiming to make data-driven decisions.
Increase your employability: Acquire the skills employers are asking for
Experience a structured and supportive approach to learning data analytics, beginning with the basics and progressing to advanced topics.


Course Curriculum
Discover Data Analytics for Business
-
Overview of data analysis
-
Roles in data
-
Responsibilities of a data analyst
-
Relevant skills, tools, and techniques for data analysis
-
Becoming a high performing Data Analyst
Data Analysis using Microsoft Excel
-
Intoduction to Microsoft Excel
-
Data Cleaning
-
Data Transformation
-
Data Compilation
-
Dashboard Creation and Data Visualization
SQL for Data Analysis
-
Introduction to SQL
-
Restore, Backup, Filterng, Sorting, Ordering
-
Alias, Aggregate, Group By, Case Statement
-
Joins And Union
-
Subqueries, Views, Ctes, Index, String & Mathematical Functions
-
Date Time Functions, Pattern (String) Matching
-
Window Functions
-
Coalesce Function, User Access Control
Mastering Data Storytelling
-
Introduction To Data Storytelling
-
How To Create A Compelling Data Story
Data Visualization with Power BI
-
Prepare Data For Analysis
-
Data Import & Transformation
-
Data Modelling and Dax
-
Data Visualization
00:00 -
Power BI Service
-
Advanced Visualization
00:00
Resume and LinkedIn Review
-
Introduction to Resume and LinkedIn Optimization
-
Crafting an Effective Resume
-
Optimizing Your LinkedIn Profile
-
Customizing Applications for Job Roles
-
Practical Workshops and Real-world Examples
-
Additional Tools and Resources
Capstone Project: Solve Data Problems with Real-world Business Projects
Building a Project Portfolio
-
Introduction to GitHub
-
Setting Up Your GitHub Profile
-
Understanding Repositories
-
Documenting Your Projects
-
Adding and Managing Projects
-
Showcasing Projects with GitHub Pages
-
Keeping Your Portfolio Updated
-
Case Studies and Examples
Graduation and Awards
Microsoft Certification Prep
Program Overview
Course 1–Discover Data Analytics for Business
- Overview of data analysis
- Roles in data
- Responsibilities of a data analyst
- Relevant skills, tools, and techniques for data analysis
- Becoming a high-performing Data Analyst
Course 2–Master Excel for Data & Analytics Success!
- Excel Fundamentals – Essential shortcuts, navigation & best practices
- Data Cleaning & Preparation – Power Query, text functions & automation
- Advanced Formulas & Functions – VLOOKUP, XLOOKUP, IF, INDEX/MATCH, SUMIFS
- Pivot Tables & Charts – Dynamic summaries & data visualization
- Data Analysis & Insights – Sorting, filtering, conditional formatting
- Power BI Integration – Connect Excel to Power BI for advanced reporting
- Dashboard Creation – Build interactive reports in Excel for data-driven decisions
Hands-on Lab Exercise | Expert Instructors | Excel Project
Course 3–Unlock the Power of Data with Power BI!
- Power BI Fundamentals – Interface navigation, workspace setup, data connections
- Data Transformation with Power Query – Cleaning, merging, and shaping data
- DAX for Data Modeling – Master key functions like CALCULATE, SUMX, and FILTER
- Measures & Calculated Columns – Create dynamic calculations for deeper insights
- Building Interactive Dashboards – Design visually compelling, dynamic reports
- Advance Data Visualization – Custom visuals, slicers, and drill-throughs
- Data Modeling & Relationships – Star schema, one-to-many & many-to-many
- Performance Optimization – Improve report speed & efficiency
- Connecting to Multiple Data Sources – SQL, Excel, and cloud databases
- Power BI Service & Sharing – Publishing and collaboration
- Real-time & Automated Reporting – Scheduled refresh & live dashboards
Hands-on Lab Exercise | Expert Instructors | Power BI Project
Course 4–Mastering SQL for Data Analytics
- Introduction to Relational Databases: Understanding tables, rows, columns, and keys.
- SQL Fundamentals (SELECT, WHERE, ORDER BY)
- Data Types: Understanding INTEGER, VARCHAR, DATE, DATETIME, etc.
- Data Aggregation (GROUP BY, Aggregate Functions)
- Joining Tables (INNER, LEFT, RIGHT)
- Data Modification (INSERT, UPDATE, DELETE)
- Advanced Queries (Subqueries, CTEs, Window Functions)
- Analytical SQL (CASE Statements)
Course 5–Python for Data Analysis
- Python Essentials: Variables, data structures, and functions.
- Pandas Power: Data manipulation and analysis made easy.
- NumPy Mastery: Efficient numerical computing.
- Data Visualization: Creating charts and graphs with Matplotlib and Seaborn.
- Real-World Data Projects: Apply your skills to practical scenarios.
Hands-on Lab Exercise | Expert Instructors | Project
Course 6–Mastering Data Storytelling
- Craft Compelling Data Narratives: Learn to tell stories that resonate.
- Visualize Data for Impact: Choose the right charts and design for clarity.
- Translate Data into Actionable Insights: Move beyond numbers to drive decisions.
- Master Storytelling Techniques: Structure your data stories for maximum engagement.
- Connect with Your Audience: Tailor your message for impact.
- Learn to present data with confidence.
Hands-on Lab Exercise | Expert Instructors | Project
Course 7–Building a Strong Project Portfolio on GitHub
- Craft a Professional GitHub Portfolio: Showcase your skills to potential employers.
- Master Version Control: Effectively manage your projects.
- Write Compelling READMEs: Clearly document your work.
- Optimize Your GitHub Profile: Make a strong first impression.
- Showcase Your Problem-Solving Abilities: Demonstrate your expertise.
Hands-on Lab Exercise | Expert Instructors | Project
Capstone Project
- Solve Data Problems with Real-world Business Projects
Still not sure if this program is right for you? Speak with one of our Career Advisors for a quick and clear answer.


